Module: Stationary Flow Visualization
Creates streamlines of a vector field and optionally animates them
| input port | type | description | data acceptors |
|---|---|---|---|
| inField | VNField | Input vector field for streamlines | Field veclen=3 component Field veclen=2 component |
| output port | type | description | data schemas |
|---|---|---|---|
| streamlinesField | VNIrregularField | output of streamlines field | |
| outObj | VNGeometryObject | complete animated geometry |
Description
The module integrates a vector field and creates static or animated streamlines or streamlines with glyph flow. The streamlines start in a user defined subset of points from within the input field.
Input data
The module requires a field with at least one veclen=3 or veclen=2 component.
Output data
At output there is a 3D irregular field of streamlines and a 3D geometry object of streamlines field.
Computation parameters
Computation tab
The user defines the vector component which will be used to generate the streamlines and the set of starting points.
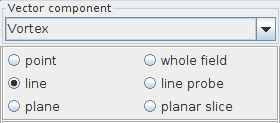
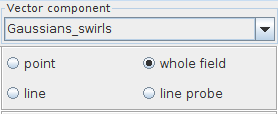
The vector component drop down list contains all input field components of veclen=3 or veclen=2. The user chooses the component for which streamlines will be calculated. By default, the first component of the list is used.
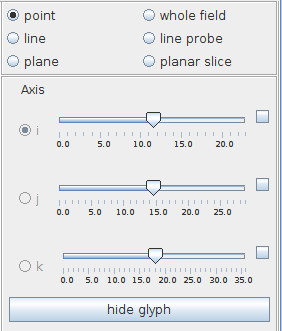
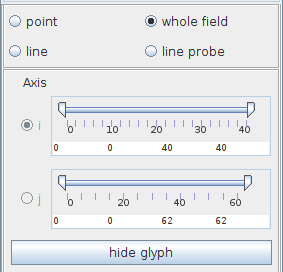
The subset of starting points is defined in the radio button menu below the vector component drop down list as the whole field or its subsets like point, line (line probe, line) or slice (planar slice, plane) can be chosen. The options depend on the data dimension.
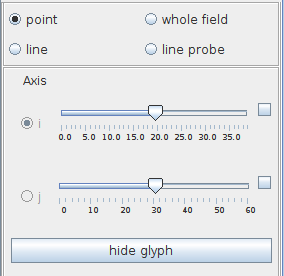
If the option point is chosen the user can adjust the starting point using the i,j,k - sliders. The glyph can be hidden by using the hide glyph option.
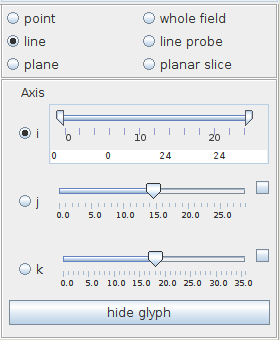
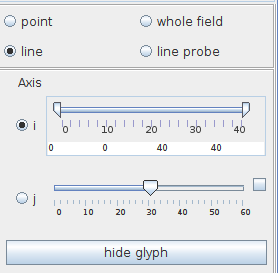
If the option line is chosen the user can adjust the line using the Axis radio button menu and appropriate i, j, k - sliders.
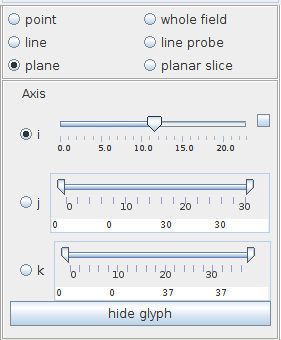
Analogously, if the option plane is chosen in 3D the user can adjust the plane using the Axis radio button menu and a Slice slider.
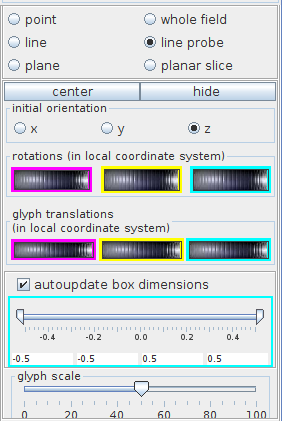
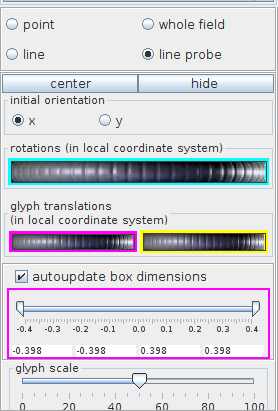
In the case of line probe a glyph appears in the viewer to signal the position of the line. The line can be placed using the initial orientation radio button menu, the rotations wheels and the translations sliders. The glyph size can also be scaled, the glyph can be hidden by using the hide option and centered using the center option.
If the autoupdate box dimensions option is switched on the line segment is automatically maximized and adapted to the 3D geometry after rotation/translation. If this option is switched off the line segment does not change. By default, this option is switched on.
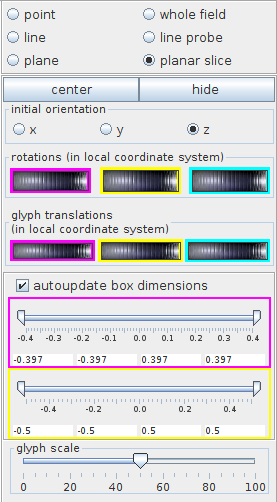
Analogously, in 3D the planar slice option turns on the planar slice glyph which can be manipulated using the initial orientation radio button menu, the rotations wheels and the translations sliders. The glyph size can also be scaled, and the glyph can be hidden by using the hide option and centered using the center option.
If the autoupdate box dimensions option is switched on the plane segment is automatically maximized and adapted to the 3D geometry after rotation/translation. If this option is switched off the area of the plane segment does not change. By default, this option is switched on.
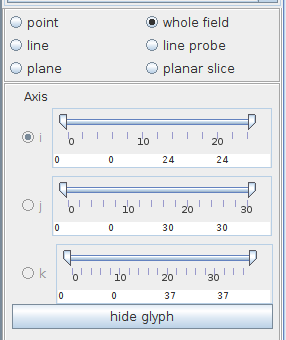
If the option whole field is chosen, the user can crop the dimensions in appropriate i, j, k - directions using the sliders. The glyph can be hidden by using the hide glyph option.
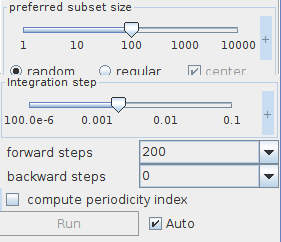
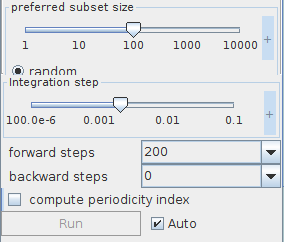
The preferred subset size is defined in the appropriate slider. Streamlines can be arranged randomly or regularly.
The integration step slider sets the integration step length for streamline integration. Smaller steps are more accurate. The user defines the integration step using either the slider or the text input fields for minimum, maximum and current value on the right hand side of the slider. The text input fields appear with mouse click at + on the right hand side of the slider, and disappear with mouse click at -.
The Steps forward and Steps backward sliders set the number of integration steps which will be used in order to compute streamlines in forward and backward directions. In both cases mouse click on the plus sign opens text input fields for minimum, current and maximum step numbers.
The compute periodicity index option by default is switched off.
Each parameter change is processed dynamically if the Auto check box is switched on. If it is switched off processing is executed by pressing the Run button. The yellow button means that there is unprocessed data.
By default the Auto check box is switched on.
Display tab
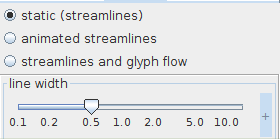
The module presents streamlines in three different ways: static, animated streamlines and streamlines and glyph flow. The user chooses the preferred presentation in a radio button menu.
Static streamlines
The user defines the line width with a slider. Mouse click on the plus sign on the right hand side of the line width slider opens text input fields for minimum, current and maximum value of line width.
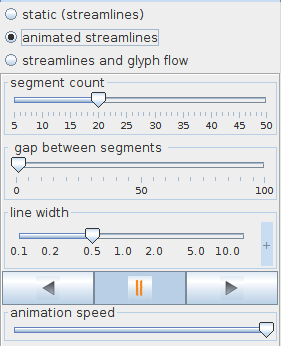
Animated streamlines
This option animates short line segments along streamlines. The length of the segments is proportional to the absolute value of velocity.
The segment count slider defines the number of segments on a streamline. The gap between segments slider defines the gap between the segments.
The user can change the line width.
A set of buttons allows to display the animation forwards and backwards and to pause the animation.
The animation speed slider changes the speed of animation.
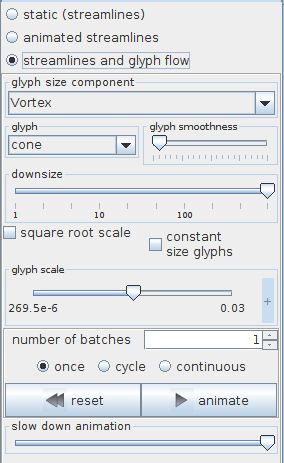
Streamlines and glyph flow
This option animates glyphs along streamlines.
The user chooses the glyph size component in a drop down list which contains all input field components. By default, the first component of the list with veclen=2 or veclen=3 is used, which is used to scale the glyphs.
There are different glyph geometries in the glyph drop down list. For scalar data these are sphere, raindrop, snowflake, box, diamond. For vector data these are arrow, arrow3D, cone, tube, circle, simple arrow, symmetric segment, segment.
The glyph smoothness slider adjusts the smoothness of glyphs.
The user can adjust the number of glyph nodes using the downsize slider. It reduces the size of the field, saving processing time and memory by "thinning out" data. Default value depends on the size of the input field and is chosen automatically.
By default, the scale of the glyphs is defined by the absolute value of the data. The user can also choose square root scale or constant size glyphs.
The glyph scale slider allows to scale the glyph size. The user defines the scale using either the slider or the text input fields for minimum, maximum and current value on the right hand side of the slider. The text input fields appear with mouse click at + on the right hand side of the slider, and disappear with mouse click at -.
The number of batches defines the number of glyphs per streamline which will be animated.
There are three options for running an animation:
- once: animation is performed once
- cycle: animation is repeated
- bounce: animation is performed out and back
A set of buttons allows to display the animation: the animate button starts and pauses the animation, the reset button sets the animation to the first frame.
The speed of the animation is defined by the slow down animation slider.
Presentation parameters
Datamap tab parameters are described in the common interfaces section under the Presentation Panel entry.