Module: Parallel Coordinates Plot
Creates visualization of variables using Parallel Coordinates
| input port | type | description | data acceptors |
|---|---|---|---|
| inField | VNField |
| output port | type | description | data schemas |
|---|---|---|---|
| outObj | VNGeometryObject | complete animated geometry |
Description
The module visualizes scalar data using 2D or 3D parallel plots. In 2D each different scalar data component is mapped onto one of the parallel axes and corresponding values connected with a line. For 3D data pairs of scalar components are mapped onto parallel planes and corresponding pairs are connected with a line.
Input data
Any field.
Output data
A geometric object of parallel axes/planes.
Computation parameters
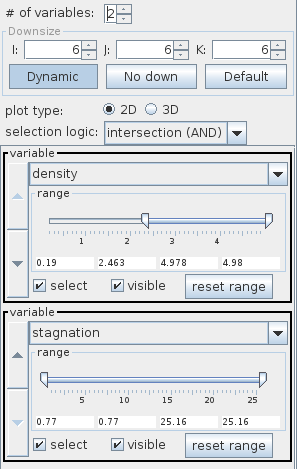
The number of variables option defines the number of data components or pairs of data components which are mapped onto parallel axes or planes, respectively.
The downsize scaling factors can be adjusted using the downsize input fields. It reduces the size of the field, saving processing time and memory by "thinning out" the data. Default downsize values depend on the size of the input field and are chosen automatically.
If the Dynamic button is pressed output is generated every time the downsize parameters change. The No down button cancels downsize. The Default button adjusts the default values for downsize.
In plot type the user chooses between type 2D - parallel axes - or 3D - parallel planes. If plot type is 2D the output of the module has to be connected to a viewer 2D module, otherwise to a viewer 3D module.
Dependently on the plot type in the variable option the user defines single scalar data components of input variables which are mapped onto parallel axes or pairs of scalar data which are mapped onto parallel planes.
All scalar data components appear in drop down menus, scalar data pairs are chosen in a pair of drop down menus. Data is shown on the axis/plane if the according visible option is switched on.
The user can choose a data range for each variable using the range slider. If the select option is switched on, all data which are inside of the individual ranges and fulfil the logical operation defined in selection logic are drawn in a different color.
The reset range button resets the data range.
Presentation parameters
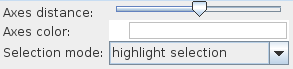
The user defines the distance of axes or planes using the Axes distance slider.
The axes or planes color can be changed with right mouse click at the Axes color button, in a new window the user chooses a new color. Dragging the axes color button brightness of the color is changed.
The Selection mode drop down menu defines the way of representing a selection as:
- highlight selection: the selection occurs in Selection color and the remaining lines in Line color
- highlight and limit selection: the selection occurs in Selection color, the remaining lines do not appear
- limit selection: the selection occurs in Line color, the remaining lines do not appear
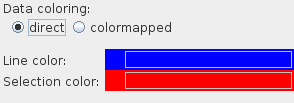
For direct Data coloring mode the user chooses Line color and Selection color in two color buttons. Right mouse click at the color button raises a color menu and with a next mouse click the user can choose a new color. Dragging the color button changes color brightness.
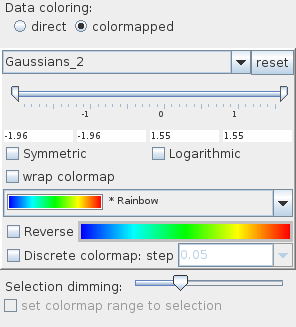
If colormapped Data coloring mode is used connection lines are colored according to the values of the chosen data component.
The Selection dimming slider describes the degree of dimming of the data connections outside selection.
The remaining datamap options are described in the common interfaces section under the Presentation Panel entry.
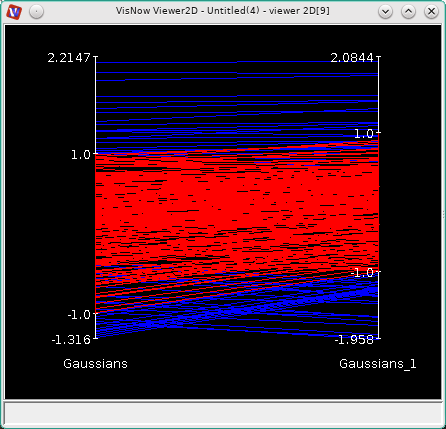
Example
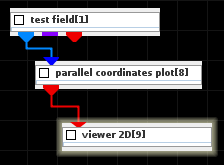
Choose the test field module from the test objects library and parallel coordinates plot from one of the field mappers library and connect all modules. In the test field module choose 2D data components Gaussians and Gaussians_1. In parallel coordinates plot choose 2 variables, 2D plot and the variables Gaussians and Gaussians_1. Select for both variables the range (-1,1). In selection logic choose intersection. In the Presentation tab choose Selection mode highlight selection.