Module: field viewer 3D
A viewer for 3D regular fields. Displays 2D cross sections and 3D geometry objects of regular 3D field data. Data analysis.
| input port | type | description | data acceptors |
|---|---|---|---|
| inField | VNRegularField | Input for 3D regular field to view | Regular Field 3D |
| inPointsGeometryField | VNField | Input for points and segments geometry | |
| inObject | VNGeometryObject |
| output port | type | description | data schemas |
|---|---|---|---|
| outPointsGeometryField | VNIrregularField | Output for selected points and connections | Irregular Field 0 cell setswith POINT cells |
Description
The idea of the Field Viewer 3D module is based on the functionality of standard medical applications. The Field Viewer 3D window includes several 2D panels with cross sections of a geometric object, a 3D panel with the geometric object, and a collection of tools for data analysis.
Input
At input there is a regular 3D field and an optional second field of any type.
Output
At output can be selected points and connections which can be stored as an irregular field to disk, re-read and input back to a Field Viewer 3D second input port.
Computation parameters
Creation of field viewer 3D module raises a Field Viewer 3D window.
In order to put the window on top of the screen the user can press the Show display frame button.
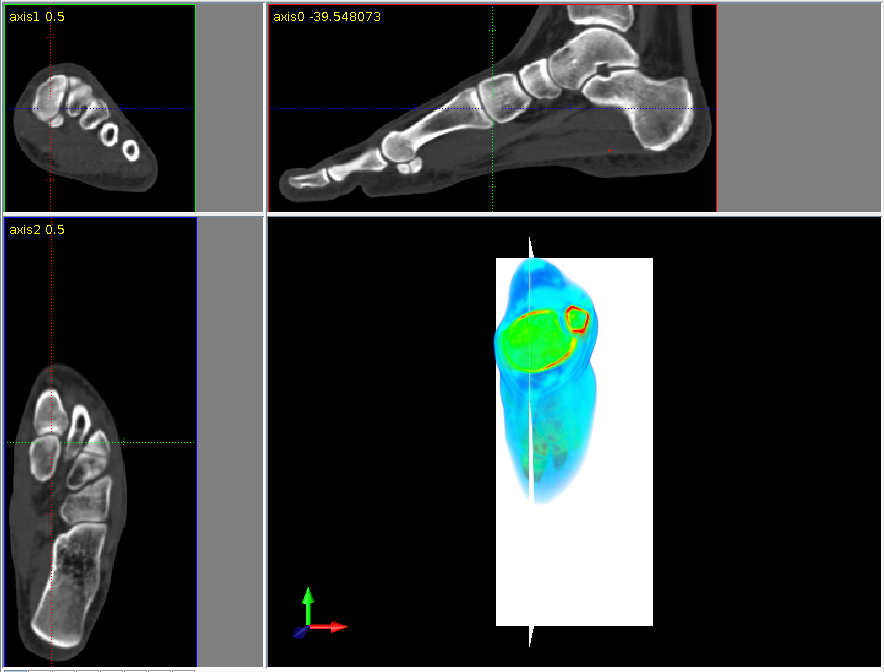
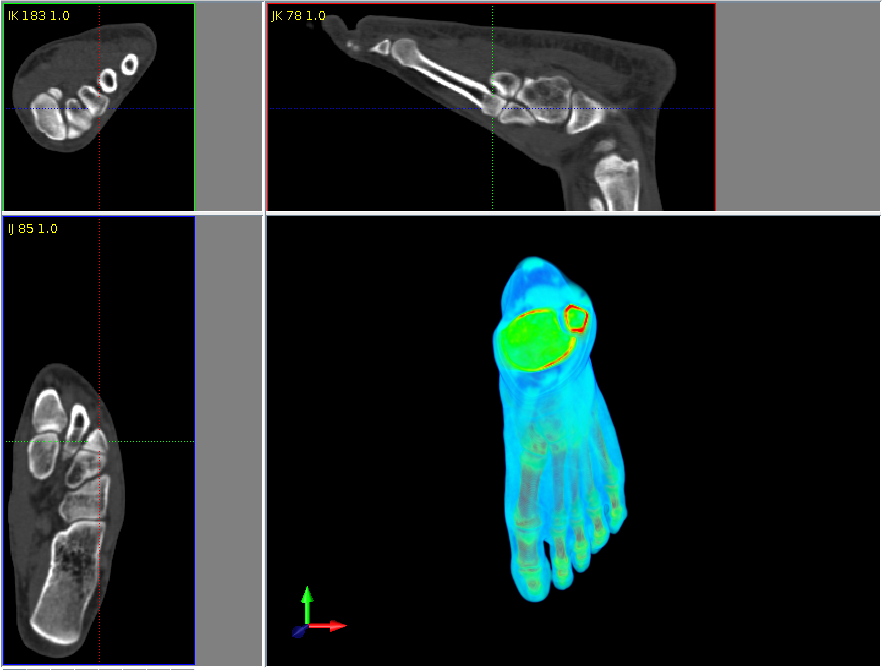
Field Viewer 3D window
The Field Viewer 3D window contains a menu bar, viewport panels with controls and toolbar and Computation and Presentation parameters UI.
Menu bar
File -> Close
Closes the Field Viewer 3D window.
**View -> View setup **
Defines the number of viewports and their arrangement in the field viewer 3D window:
- Quad View: 4 viewports
- Double View Horizontal: two viewports arranged horizontally
- Double View Vertical: two viewports arranged vertically
- Single View: one viewport
View -> Viewport contents
Defines the contents of the viewports:
- Predefined Setups: dependently on the number of viewports the user can choose a predefined Setup
- Custom Setup: the user defines the contents of each viewport separately
View -> Reset to defaults
Resets all changes.
**Viewport panels with controls **
Viewport panels
The viewer includes max 4 panels with synchronized contents. Their contents and functionality vary depending on the mode defined as Indexed, Custom and CustomOrtho, and also on the View and Viewport Setups. The description below assumes that default View and Viewport Setup is chosen.
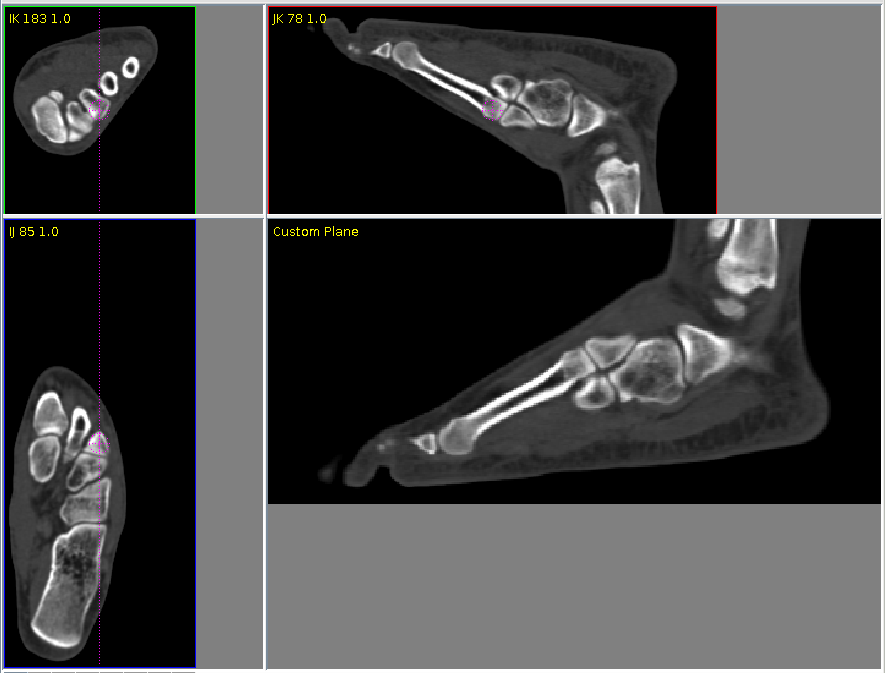
Indexed
There are three 2D slice panels with slice planes in three perpendicular indexed directions of the object and a 3D panel with the 3D geometry object.
Frame color and colors of the dotted lines in each 2D panel are related to three perpendicular planes which are associated with three directions of the orientation glyph in the 3D panel.
The user may change the position of the slice planes in the 2D panels:
- picking up a line - the cursor changes into a small two-sided arrow - and moving the line
- picking up the line intersection - the cursor changes into a cross of two-sided arrows - and moving the intersection
- double mouse clicking at a new position moves the cross to the new position
- scrolling the mouse wheel
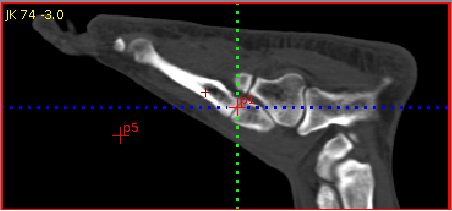
Custom
There are three 2D slice panels with slice planes in three perpendicular index directions of the object and a 2D custom slice panel with a slice of the user's choice.
The dotted purple lines in the three slice panels represent the intersection with the user defined slice plane. By changing the position of the lines the user redefines the custom slice.
The user may change the position of the purple lines:
- picking up the small circle on or near the line - the cursor changes into a cross of two-sided arrows - and moving the circle along with the line
- picking up the line apart from the small circle - the cursor changes into a rotation sign - and rotate the line
- double mouse clicking at a new position moves the circle to the new position
The user may change the position of the slice planes by scrolling the mouse wheel.
CustomOrtho
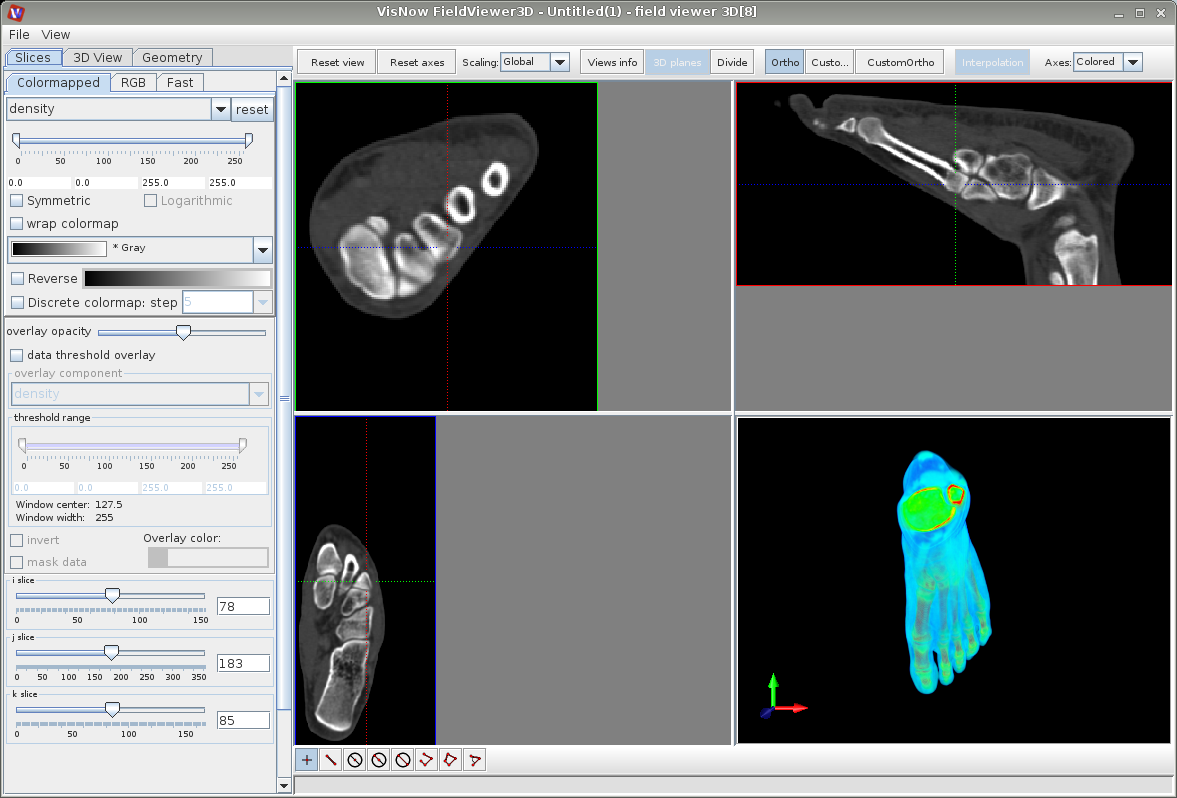
There are three 2D slice panels with slice planes in three perpendicular directions and a 3D panel with the 3D geometry object and white colored slice planes.
Frame color and colors of the dotted lines in each 2D slice panel are related to the directions of the orientation glyph in the 3D panel only after pressing the Reset axes button.
The user may change the position of the slice planes in the 2D slice panels:
- picking up a line between line intersection and a marker - the cursor changes into a cross of small two-sided arrows - and moving the line
- picking up the line intersection - the cursor changes into a cross of two-sided arrows - and moving the intersection
- double mouse clicking at a new position moves the cross to the new position
- scrolling the mouse wheel
- picking up a dotted line apart from the marker - the cursor changes into a rotation sign - and rotate the line
For all 2D slice panels there are available:
- Shift + mouse wheel: zooms the slice plane
- Shift + left mouse button: moves the slice plane
In both cases Scaling mode changes to Manual.
For 3D panels see the description of the Viewer 3D Mouse and Keyboard Controls and Viewer 3D Controls Window in the appropriate sections of the Viewer 3D module.
Controls
The Reset view button restores the scaling of the geometric objects in all panels, switches to Global scaling and enters Indexed mode. A second mouse click optimizes the size of the panels.
The Reset axes button resets to default slice planes.
The Scaling drop down box defines scaling mode:
- Global: scaling of slices in 2D panels is identical, slice planes fit into the panels
- Auto: scaling of slices in 2D slice panels may be different and is as large as possible as to fit into the panels
- Manual: scaling of slices in 2D panels may be different, slice planes may not fit into the panels.
If Views info button is pressed there appears information about the localisation of the exposed slice planes:
- Indexed and Custom modes: slice index and coordinate
- CustomOrtho mode: slice coordinate
By default this button is not pressed.
In CustomOrtho mode the 3D planes button switches the planes in the 3D panel on and off. By default the button is pressed.
The Indexed, Custom and CustomOrtho buttons define the content of panels and functionality of Indexed, Custom and CustomOrtho modes.
The Axes drop down menu defines the color of the dotted lines in the 2D slice panels as Colored, Blue, White, Black or switch them off: None.
The Width text field defines the width of dotted lines and frames of the 2D slice panels.
Computation parameters
Slices
The tab contains options for 2D panels.
slices colormap
The slices colormap options are described in the Data map options section under the Presentation Panel entry.
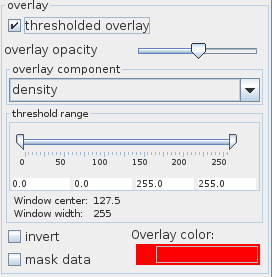
overlay
Data overlay can be used in order to overlap the slices colormap component with a second monochrome overlay component.
This option is active if the thresholded overlay checkbox is switched on. By default it is off.
The overlay component is defined in the overlay component drop down list. The user chooses the opacity of the component with the overlay opacity slider. The threshold range slider allows the user to change the mapped value range. Values below slider minimum or above slider maximum are not mapped.
If the invert option is switched on the complementary part of the data range is mapped. If mask data is switched on data outside the threshold range is masked out.
The mono-color of the overlay component is defined by clicking the Overlay color button and choosing a color from the color panel. Change brightness by dragging the overlay color button in the left/right direction.
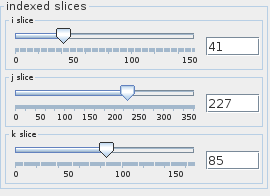
indexed slices
The indexed slices options contain sliders and text input fields which can be used in order to choose slice planes in the 2D slice panels. The options are active if Indexed or Custom mode is selected.
3D View
The tab contains options for 3D panels.
data mapping
The data mapping options are described in the Data map options section under the Presentation Panel entry.
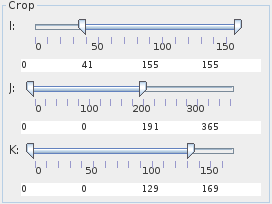
crop
The Crop sliders select the geometric extents of the regular field, i.e. lower and upper array indices in their respective dimensions. In order to change the extents the user uses the sliders or the text input fields below the sliders.
Geometry
The options enable the user to define points, lines, measure distances and angles.
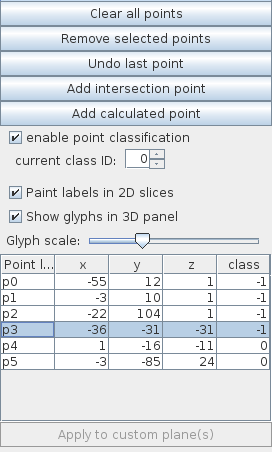
points
Coordinates from the second input port field data are listed in the points list. If the second input port is empty, the point list is empty.
Note that the points from the input port are pulled to the nearest vertices of the regular field visualized in field viewer 3D. This means that the points inside the visualized area are moved to the nearest vertex in a cell. The imported points lying outside of the main field area can be significantly displaced to the external surface, edge or vertex. This means that the second input port of the module is best used with previously defined and saved selections.
In order to define a point the user clicks the right mouse button on a 2D slice panel or the 2D custom panel. By default the new point appears in red color as a cross with a label in the 2D panel and as a point in the 3D panel. Successive points are labeled p0, p1, p2 … Points which do not lie at the slice plain but near the plane appear as smaller red crosses without label.
All new points and their coordinates are listed in a points list.
In order to define a point in the 3D panel the user switches on the pick 3D active option in the Viewer 3D controls general tab, or by choosing “.”. Left mouse button click defines a straight line perpendicular to the 3D panel which will be visible after rotating the geometry object. A second mouse click at the line defines a new point. Point name and coordinates appear in the points list only if located inside the geometry object.
The user can clear all points by pressing the Clear all points button. Selected points can be removed by pressing the Remove selected points button.
The user selects a point either by Ctrl+left mouse click at the point in the 2D panel or choosing a series of points in the table. Selected points and their labels are purple colored.
The Undo last point button removes the last added point.
Pressing the Add intersection point button adds the intersection point of all slice planes.
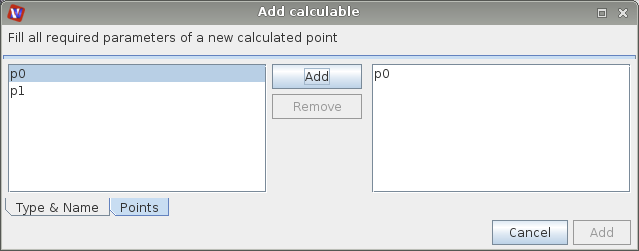
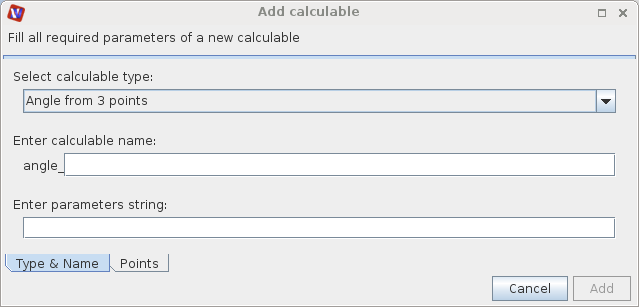
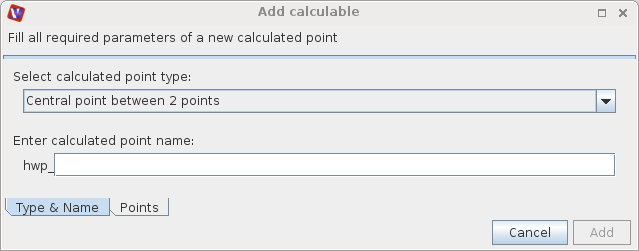
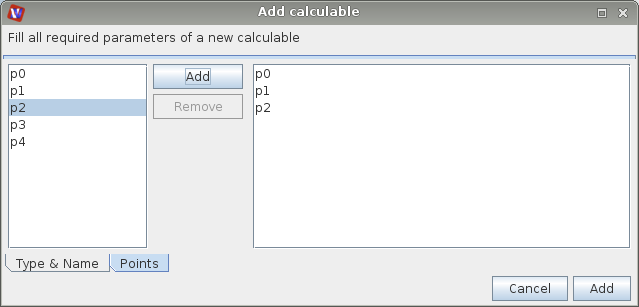
The Add calculated point button raises a dialog window which can be used in order to generate a new point:
In the Type & Name tab the user defines the method of point generation in a drop down menu and enters a point name. The new point has a prefix dependent on the point generation method.

In the Points tab the user chooses all elements which are needed in order to generate a new point. After marking an element on the left hand side the Add button has to be pressed in order to add it to the list on the right hand side. Selected elements can be removed using the Remove button. The new point is created by pressing the Add button on the right hand side below the elements list.
Methods of point creation, necessary elements and their appropriate order, point name prefix:
- Central point between 2 points: calculates a point in the middle of two points. The user chooses two points. The new point name has the prefix hwp._
- Nearest ‘crossing’ of 2 segments: calculates the point in the middle of the shortest connection between two straight lines. Since each line is defined by two points, the user chooses two pairs of points. The new point has the prefix_ xing_._
- Point to plane cast: orthogonal projection of a point onto a plane. The user chooses the point which has to be projected and three points which determine the plane. The new point has the prefix pcast._
- Weighted central point: creates the central point of all given points in the list. The user chooses any number of points. The new point has the prefix wght._
- Point to axis cast: orthogonal projection of a point onto a straight line. The user chooses the point which has to be projected and two points which determine the straight line. The new point has the prefix acast._
All created points appear in the point list together with their coordinates and their classification class (if the option is switched on). The user can change a table entry by double-clicking the entry and editing.
If the enable point classification check box is switched on all points can be classified in appropriate groups. The class of an existing point can be changed in the class entry of the table of points or adjusted in advance of point generation in the current class ID text field. By default point classification is switched off.
The Paint labels in 2D slices option enables the user to switch point labeling in the 2D slices on and off. The Show glyphs in 3D panel option decides if point glyphs in 3D panels are shown. The size of the glyphs is defined by the Glyph scale slider.
The user can create a Custom slice through three points by choosing three points from the point list and pressing the Apply to custom plane button. The custom slice plane appears in Custom mode.
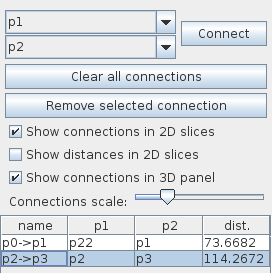
connections
Segment cells from the second input port field data are listed in the list of connections. If the second input port is empty or if there are no segment cells, the list of connections will be empty.
The options in the connections tab allow the user to connect two points.
The two drop down menus on the top define two different points which will be connected when the Connect button is pressed. All connections are listed in a table. The connections are named following the names of the points in the moment of connecting. The table also lists the distance of the points.
The Clear all connections button deletes all connections. The Remove selected connections button deletes selected connections.
Connections are shown in 2D panels if the Show connections in 2D slices option is switched on, if Show distances in 2D slices is switched on also distances are shown in Indexed and Custom mode.
If the Show connections in 3D panel option is switched on, connections are shown in 3D panels.
The width of these connection lines can be changed using the Connections scale slider.
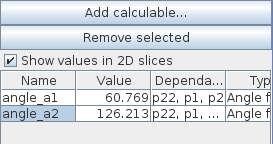
calculables
The calculabes tab is used to calculate angles, length of polylines and distances.

Pressing the Add calculable button raises a dialog window which can be used in order to measure an angle, the length of a polyline or a distance:
In the Type & Name tab the user selects the type of measurement and a value name which has a prefix depending on the measured object.
In the points tab the user chooses all elements which are needed in order to make the measurement. After marking an element on the left hand side the Add button has to be pressed in order to add it to the list on the right hand side. Selected elements can be removed by pressing the Remove button. The measurement is done by pressing the Add button on the right hand side below the elements list.
All measured elements appear in a list with their names, values, dependencies and types. They can be removed by selecting them from the table and pressing the Remove selected button.
Following objects can be measured,
- Angle from 3 points: measures an angle which is defined by three points. The user chooses three points with the vertex at the second position. Name prefix is angle._
- Angle from 2 lines (4 points): measures an angle between two straight lines where each line is defined by two points. Name prefix is angle._
- Signed angle from 2 lines (4 points) and reference plane (3 points):
- Modifiable signed angle from 2 lines (4 points) and reference plane (3 points):
- Length of a polyline: measures length of a polyline defined by any number of points. Name prefix is length._
- Distance: measures the distance of two points, the user chooses the two points. Name prefix is dist._
- Signed distance:
- Normalized signed distance:
If Show values in 2D slices option is switched on the measured values are displayed in the 2D slice panels.
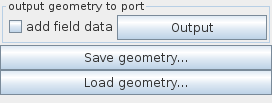
Data output
Press the Output button in order to pass generated data to the output port. If the add field data option is switched on field data at generated points are added.
Use Save geometry in order to save information about generated points and connections to a file. Load geometry loads information from a file.
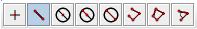
Toolbar
The toolbar below the panels are useful in generating points, connections and angles in 2D panels, from left to the right these are:
- Point tool: right mouse click at a point
- Line tool: right mouse click at beginning and end point
- Center point tool: center point of a circle - right mouse click at beginning and end points of the diameter of a circle
- Radius tool: right mouse click at beginning and end points of the radius
- Diameter tool: right mouse click at beginning and end points of the diameter
- Polyline tool: choose each point with right mouse click and the last point with double right mouse click
- Polygon tool: choose each point with right mouse click and the last point with double right mouse click
- Angle tool: choose three points with right mouse click