Presentation panel
In this section most common options for the visual presentation of geometry objects are described. Specific, module dependent options are explained in the particular module entry.
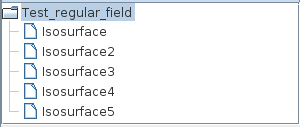
In the case of data including several sets of irregular data fields all fields are listed in the Presentation panel. The user will be able to change presentation options for each individual set separately by choosing the set. In this case the inherit (data map, rendering) option will be switched off.
Datamap Options
Mapping Parameters
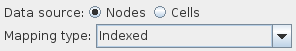
The Data source radio button menu informs whether the geometry object is colored according to field node values or cell data.
The user chooses the Mapping type as Indexed, RGB or Textured.
Indexed Mapping
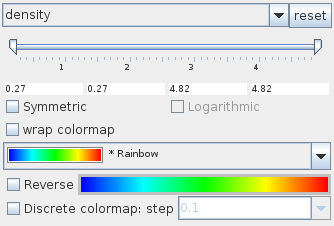
The color component drop down list determines the component from the input field which is used in order to color the output geometry object. By default the first component is used. null uses gray shade.
The range slider allows the user to change the value range onto which the colormap is projected. Color component values below slider minimum or above slider maximum are colored by minimum or maximum colormap value, respectively, unless the option wrap colormap is chosen. If the wrap colormap is switched on the color map is periodically mapped onto the range.
By default the whole color component range is used.
If the Symmetric option is switched on the mapped range is extended to become symmetric with respect to 0 in such a way that it contains the original range. In this case the option Logarithmic is available. The reset button on the right hand side of the color component drop down list resets changes of the data value range.
The color map drop down list enables the user to choose between several predefined color maps:
- Rainbow
- Gray
- Hot
- bicolor
- tricolor
- cool-warm
- Hot 1
- Blue - Black - Red
- Blue - White - Red
- Medical
- Geo. 0-based
- Geographical - land
- Geographical
- blue - red - yellow
- Full rainbow
- RGB
- Random grayscale
- Random colormap
- Black - Red
- Black - Green
- Black - Blue
- Medical
The default color map is Rainbow.
Bicolor and tricolor maps allow the user to build his or her own colormap by assigning two or three colors, respectively. By choosing bi- or tricolor map there appear two or three color buttons below the drop down list. Mouse click on a button raises a color panel from which the user can choose the desired color by a next mouse click. Change brightness by dragging the button into the left or right.
In all other cases the user can reverse the maps by switching on the Reverse check box. By default it is switched off.
If the Discrete colormap option is switched on the quality of the colormap discretization can be adjusted either by choosing a value from the step drop down menu or typing a value. By default this option is switched off.
If the color component is null instead of the colormap drop down list, reverse and discretization options there appears a color button for choosing color and brightness as described above in the case of bi- and tricolor maps.
RGB Mapping
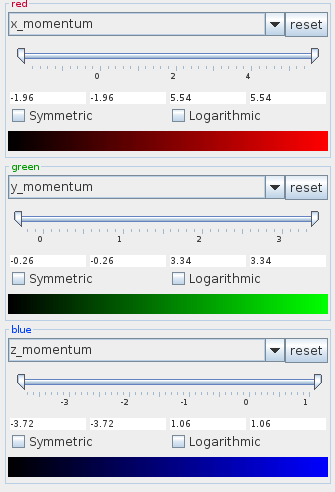
The user defines red, green and blue color components in three drop down menus. The value range of a component is linearly mapped onto a range between low brightness (black color by default) to red, green or blue color. The user can change the lower value by dragging the brightness slider.
The data range slider changes the value range of the color component. Values below slider minimum or above slider maximum are given the color of the minimum or maximum value.
If the Symmetric option is switched on the mapped range is extended to become symmetric with respect to 0 in such a way that it contains the original range. In this case the option Logarithmic is available. The reset button on the right hand side of the color component drop down list resets changes of the data value range.
Textured Mapping
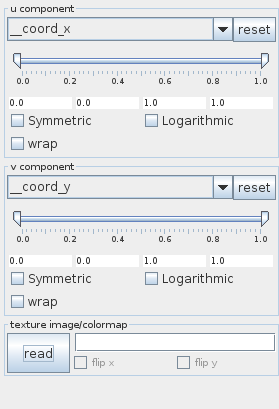
In order to map texture onto a geometry object read a texture image/colormap by pressing the read button and selecting a file in the file browser or typing the file name into the text input field on the right hand side of the button. The image/colormap can be flipped using flip x and flip y options.
The u component and v component menus define the way of the mapping.
The user chooses appropriate components from the drop down lists: input components, indexes in the case of regular fields, coordinates.
Examples:
Let the field be 2D regular. Choose a texture image.
- For the u and v components choose the same component. Then this component is presented using a colormap from the diagonal of the texture image:
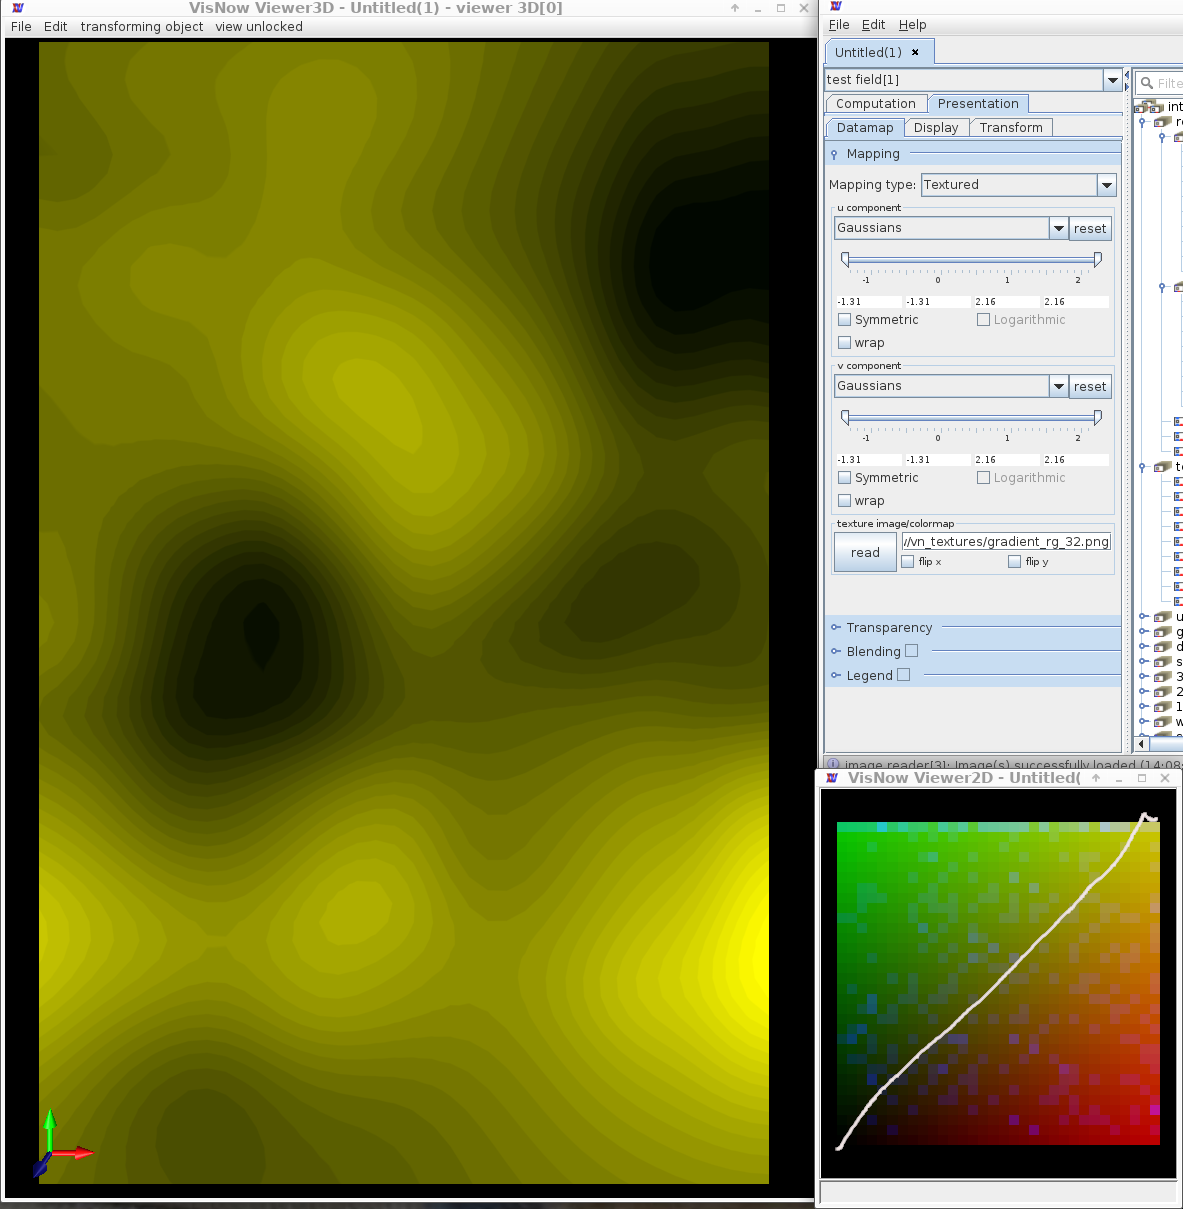
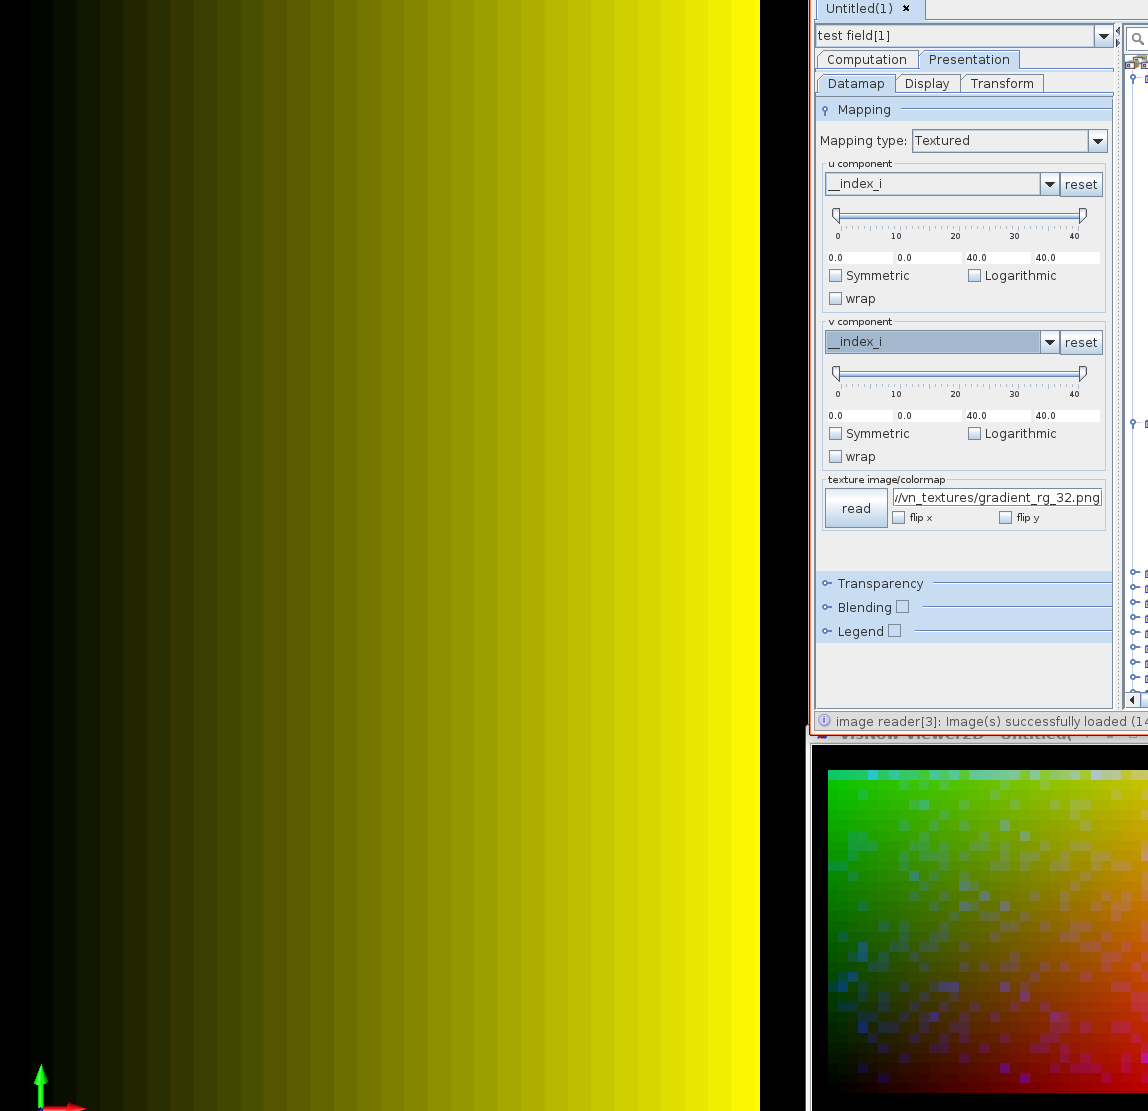
- Choose __index_i for both u and v components. The colored component then is the i-index, again colored with a colormap from the diagonal of the texture image:
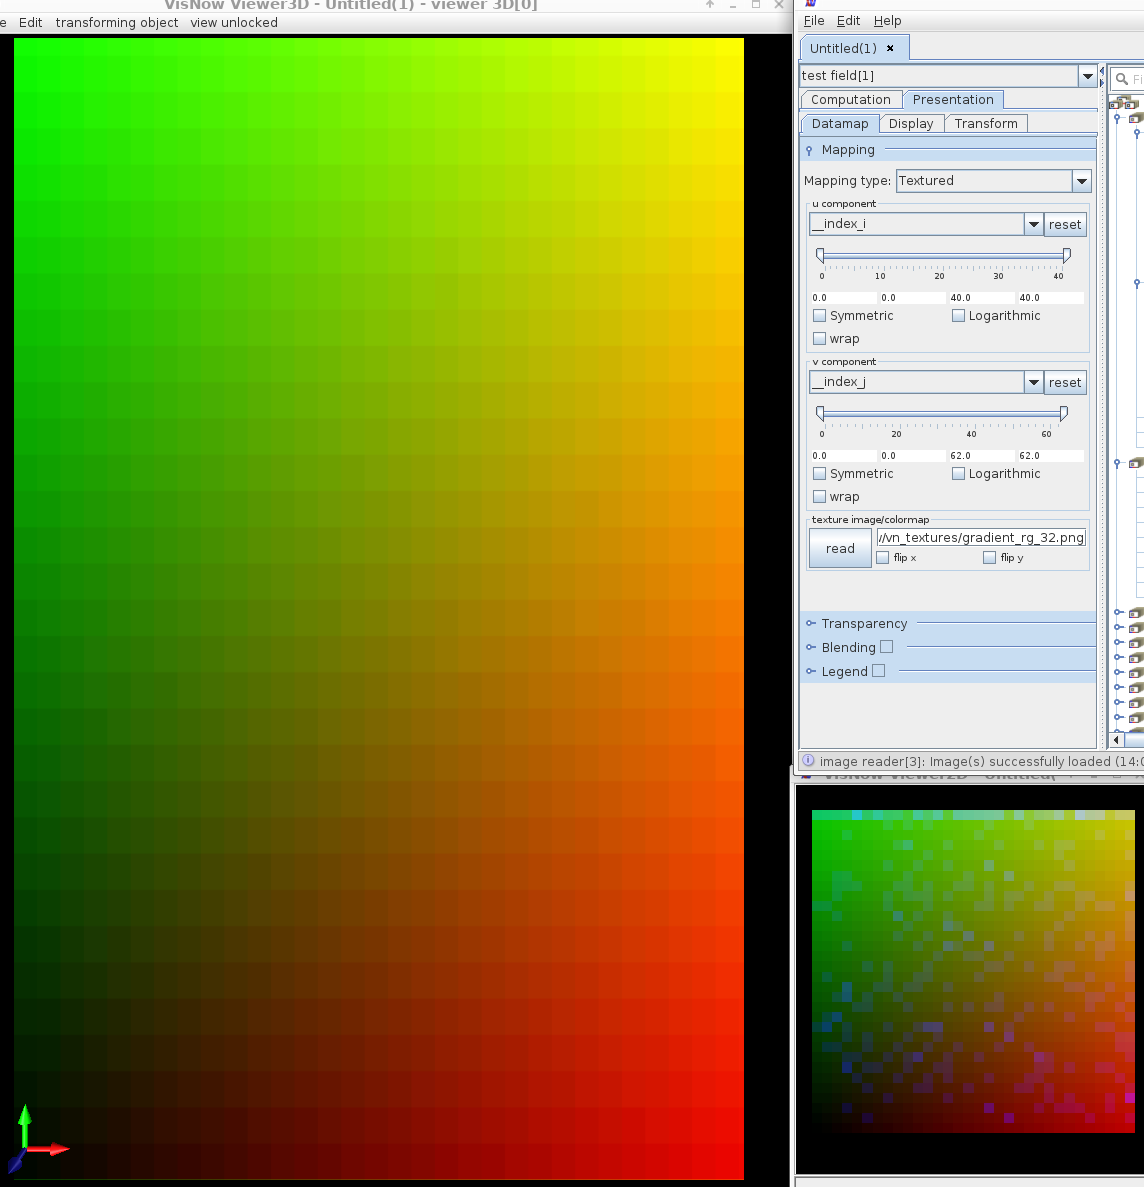
- Choose __index_ i for the u component and __index_j for the v component. In this case the texture is stretched to the extent of the 2D field.
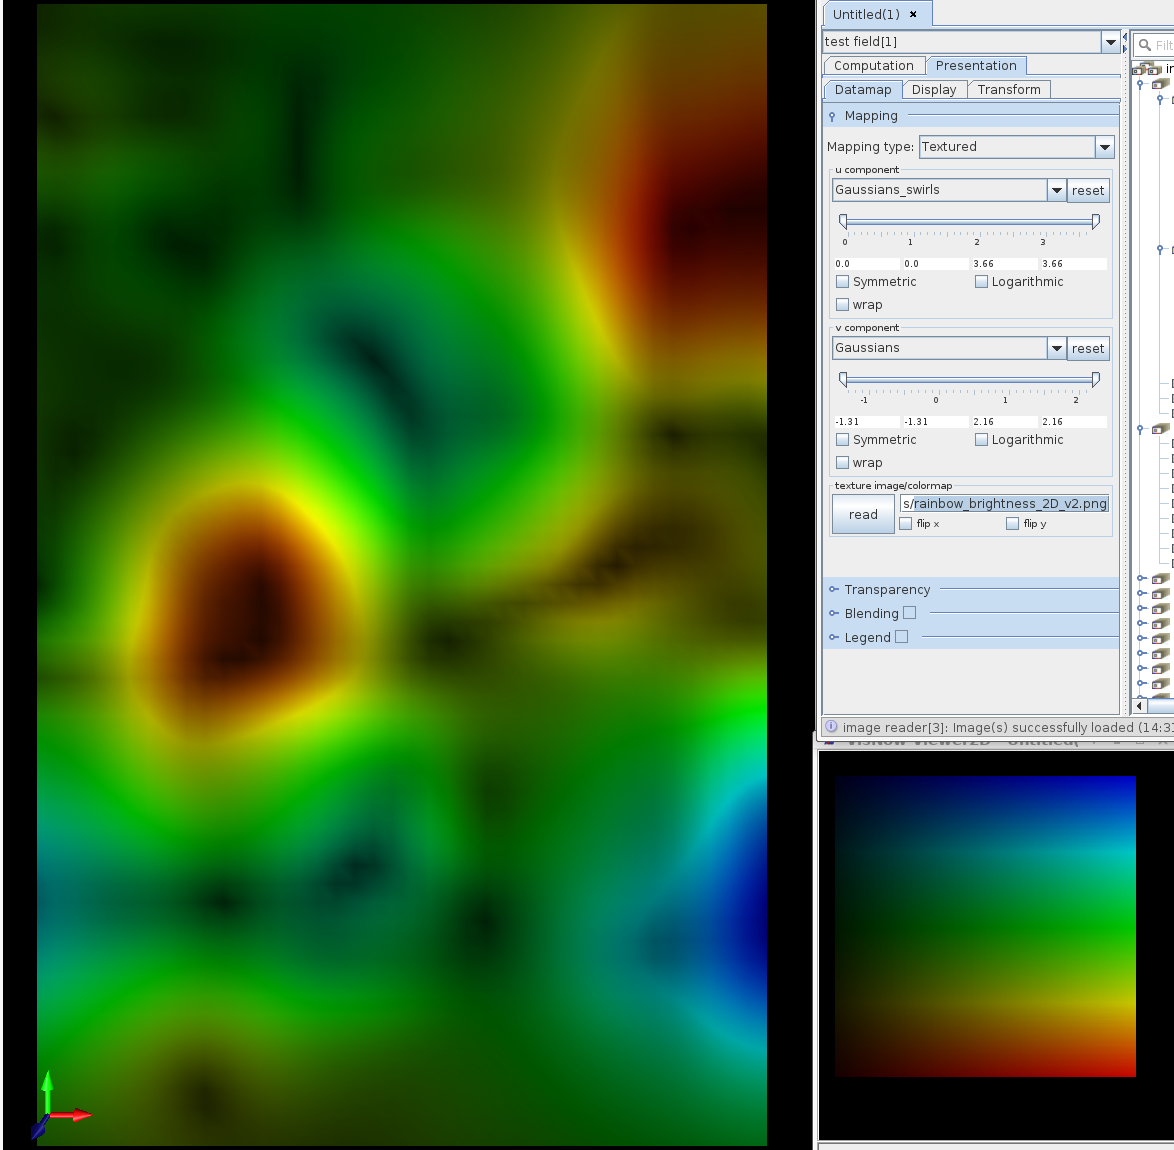
- For the v component choose a field component and for u component the gradient of the field component. The texture image in the vertical extent is the rainbow map, in the horizontal extent it represents brightness. Finally the field component is presented in rainbow colors, however bright color appears in the case of high gradients.
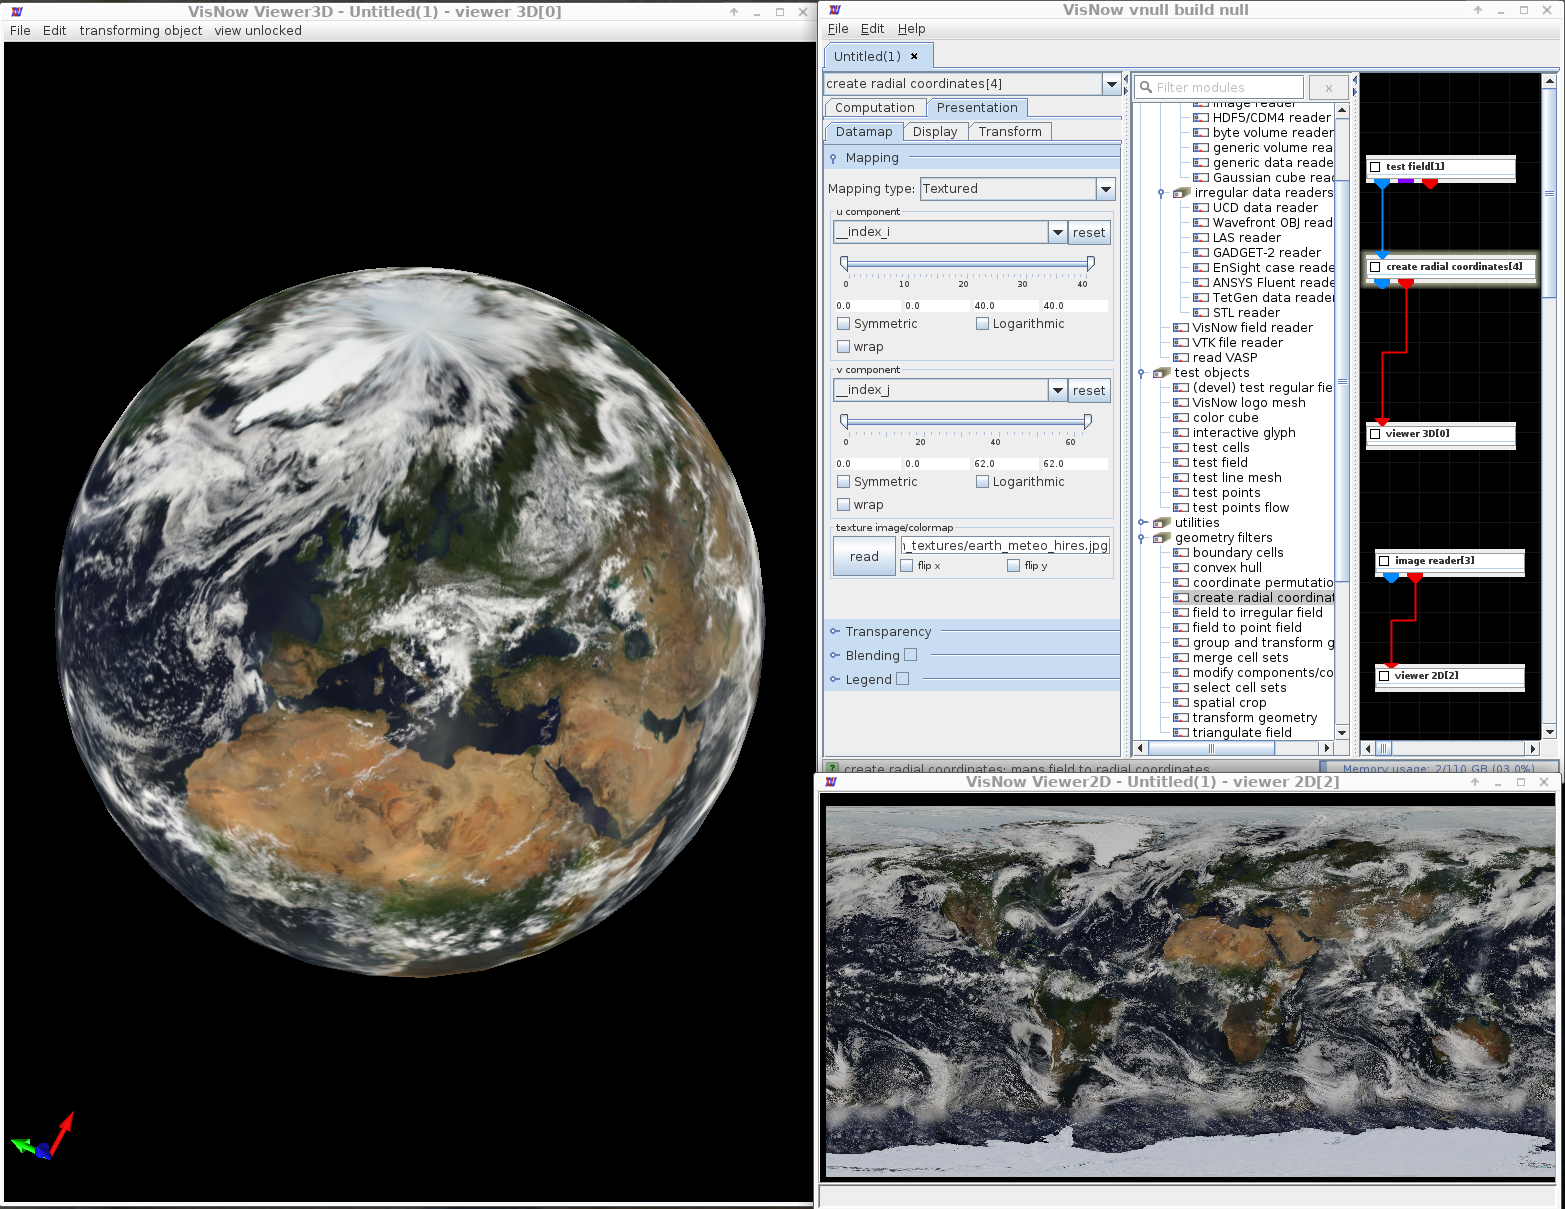
- Let the 2D regular field be a sphere. Choose __index_i for the u component and __index_j for the v component. Let the texture be the world map.
The range sliders define the value range onto which the texture is mapped. Values below slider minimum or above slider maximum are colored by minimum or maximum value, respectively, unless the wrap option is chosen. By default the whole component range is used.
If the Symmetric option is switched on the mapped range is extended to become symmetric with respect to 0 in such a way that it contains the original range. In this case the option Logarithmic is available. The reset button on the right hand side of the component drop down list resets changes of the data value range.
Transparency
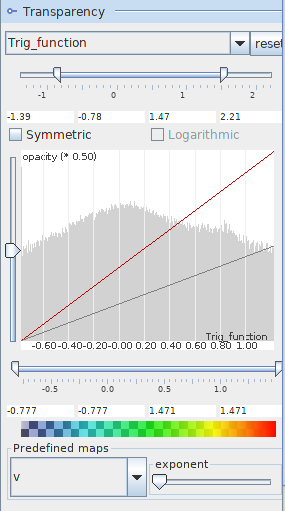
The transparency of the geometry object depends on the transparency component which is defined in the drop down list and the transparency mapping. If the transparency component is null no transparency is applied.
The mapped data range slider allows the user to change the range of the transparency component. For values below or above the range the minimum or maximum range value is used, respectively. By default the whole range is used.
If the Symmetric option is switched on the mapped range is extended to become symmetric with respect to 0 in such a way that it contains the original range. In this case the option Logarithmic is available. The reset button on the right hand side of the component drop down list resets changes of the data value range.
The curve in the transparency map defines opacity at the y-axis depending on the transparency component value on the x-axis. The red colored opacity function is editable by dragging the curve: left mouse button for free drawing, Shift+left mouse button for drawing a straight line, right mouse button for smoothing.
The effective opacity value is represented by the gray colored line which is proportional to the red line by a factor between 0 and 1. This factor can be chosen by dragging the y-slider. The x-slider allows the user to cut the value range from below by setting opacity equal zero for values below the minimum value. The bar below the transparency map illustrates chosen values for transparency and color.
In the background of the transparency map the histogram of transparency component values is presented.
Finally, the user can choose between several predefined transparency maps.
Blending
Blending is a way of modifying the original color of the color component with color/saturation/brightness of a second field component.
The Type drop down menu defines the type of blending as alpha, saturation or brightness.
Alpha
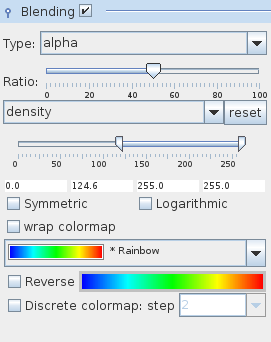
Alpha blending mixes color values of two components linearly in order to produce a third color using the formula:
colorOfOriginalColorComponent*(1.0 - ratio/100) + colorOfBlendColorComponent*ratio/100
The Ratio slider defines the blend rate. By default the rate is 50.This option can be useful if we search for dependence between two components.
The component drop down list determines the blending component. By default the first field component is used.
The range slider allows the user to change the value range onto which the colormap of the blending component is projected. Color component values below slider minimum or above slider maximum are colored by minimum or maximum colormap value, respectively, unless the option wrap data is chosen. By default the whole color component range is used.
If the Symmetric option is switched on, the mapped range is extended to become symmetric with respect to 0 in such a way that it contains the previous range. In this case the Logarithmic option is available. The reset button on the right hand side of the component drop down list resets changes of the data value range.
The color map drop down list enables the user to choose between several predefined color maps, as indicated in the description of the Mapping parameters.
The user can reverse the maps by switching on the Reverse check box. By default it is off.
If the Discrete colormap option is switched on the quality of the colormap discretization can be adjusted either by choosing a value from the step drop down menu or typing a value. By default this option is switched off.
If the blending component is null instead of the colormap drop down list, reverse and discretization options there appears a color slider for choosing color and brightness.
Saturation/Brightness
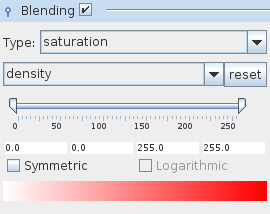
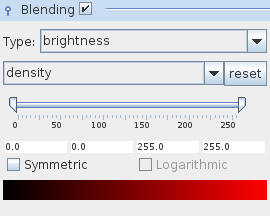 The higher the value of the saturation/brightness component the more saturated/brighter is the color of the geometry object. Combining two different components their data ranges are mapped one onto the other.
A drop down list determines the modification component. By default the first field component is used.
By dragging the saturation/brightness slider the user can change the minimum saturation/brightness used for modification.
The data range slider changes the value range of the saturation/brightness component. Values below slider minimum or above slider maximum are given minimum or maximum saturation/brightness.
If the Symmetric option is switched on, the mapped range is extended to become symmetric with respect to 0 in such a way that it contains the previous range. In this case the Logarithmic option is available. The reset button on the right hand side of the component drop down list resets changes of the data value range.
Legend
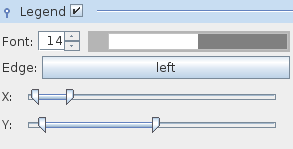
Select the Legend checkbox in order to show the color legend in the viewer window.
Choose the font size of text and numbers in the Font text box. Define their color by raising the color panel with mouse click on the color button and choosing the color by a next mouse click. Drag the mouse on the color button into the left/right direction in order to change brightness.
The Edge parameter describes the position of the legend in the viewer window. Press the button in order to choose the left, bottom, right or top position of the legend.
The X and Y location sliders determine vertical and horizontal position and width and length of the legend.
Display Options
 The above options are available for 3D regular field data.
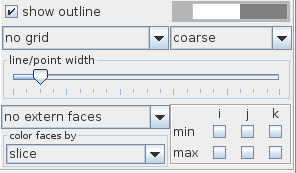
If the show outline option is switched on the external edges of the field are shown. Use the color button in order to change the color of the edges. Mouse click on the button raises a color panel from which the user can choose the desired color with a next mouse click.
A drop down list sets up the representation of the data as no grid, point grid, line grid or volume rendering:
- no grid: no grid representation is shown
- point grid: positions of grid nodes are shown as points
- line grid: a line grid is shown
- volume rendering: data are shown using volume rendering
In case of point and line grid a second drop down list defines the grid density as coarse, fine, very fine.
By default there is no grid chosen.
In the case of volume rendering there appear some shading options:
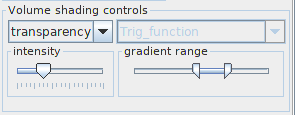 The user can choose no shading, transparency and component.
The line/point width slider defines the width of lines or points.
In a next drop down list with the option no extern faces, inside of box, box and selected faces the user decides about the appearance of the external faces.
The inside of box option shows all external faces which do not cover the inside of the geometry object independently of its position. The box option shows all external faces. In case of the selected faces option the user chooses faces which are to be shown in a menu on the right hand side of the drop down list.
By default no extern faces is chosen.
When faces are shown the option in a second drop down box defines their coloring. By default the slice option is switched on. In this case the face is colored by its values. For average projection the average value and for maximum projection the maximum value of all values perpendicular to the face is used.
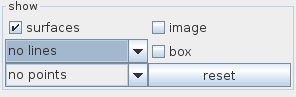 The above options appear in the case of 2D regular data. The user decides if the data will be presented by no lines/lines, no points/points, as surface, image and if the field will be surrounded by a box. The reset button restores all options.
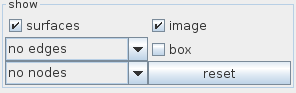 These options appear in the case of 2D irregular data and part of them in the case of point data. The user decides if the data will be presented by no edges/line cells/all edges, no nodes/point cells/all nodes, as surface, image and if the field will be surrounded by a box. The reset button restores all options. Note the difference between line cells and all edges and point cells and all nodes.
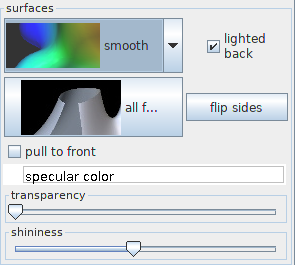 The shading drop down list allows to choose surface shading as smooth, flat, unshaded or background:

- smooth: shading, interpolates the smooth surface shape.
- flat: shading, all triangles are represented as flat surfaces.
- unshaded: no shading, triangles are represented only by color.
- background: line representation of surface triangles showing only front triangles.
The lighted backside checkbox allows the user to switch on light from the backside of the surface. By default this option is switched on.
The faces multi state button allows to switch between one of three options:
- all faces (default): front and back faces are visible.
- front faces: only front faces are visible.
- back faces: only back faces are visible.
The flip sides button changes surface orientation.
If the pull to the front of the scene checkbox is switched on the geometry object is on the top of the scene. By default this option is switched off.
The specular color button allows you to choose a reflection color by clicking at the button and choosing a color from the raised color panel with a next mouse click. In order to change brightness drag the button into the left/right.
The transparency slider adjusts the transparency of the geometry object from opaque on the left to transparent to the right side of the slider.
The shininess parameter determines the visual appearance of surfaces.
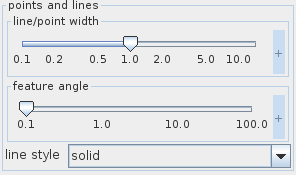
The line/point width slider changes line width and point size. The user defines the width/size using either the slider or the text input fields for minimum, maximum and current value on the right hand side of the slider. The text input fields appear with mouse click at + on the right hand side of the slider, and disappear with mouse click at -.
The feature angle slider defines a minimum angle between the normals of two neighboring triangles. For angles below this value edges are not drawn.
The user defines the angle using either the slider or the text input fields for minimum, maximum and current value on the right hand side of the slider. The text input fields appear with mouse click at + on the right hand side of the slider, and disappear with mouse click at -.
The line style drop down list allows the user to choose between solid, dashed, dotted, dashdot line style. The default style is solid.
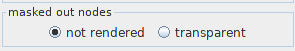
In the case of masked out nodes, the user has two possibilities. If not rendered is chosen masked nodes are not presented, if transparent is chosen, masked nodes are presented in gray color.
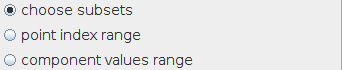
For point data the user can choose in a radio button menu between the options choose subsets, point index range and component values range.
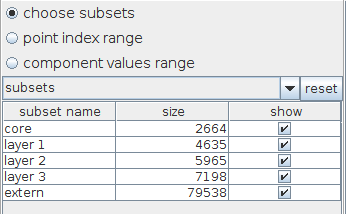
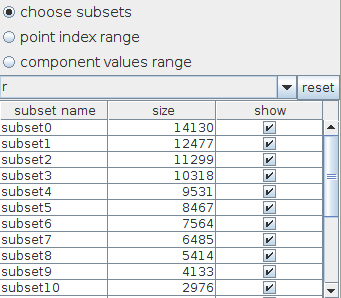 In the case of the option choose subsets ...
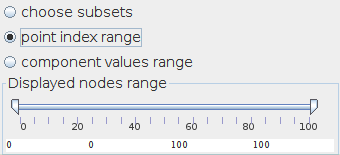
In the case of point index range …
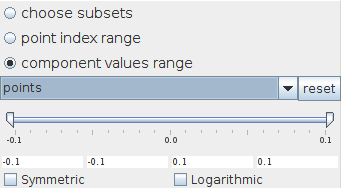
In the case of the option component values range ...
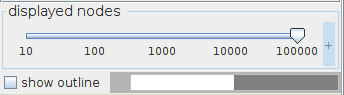
The displayed nodes slider defines the number of displayed nodes in the viewer. If the show outline option is switched on an outline of the field extents appears in the viewer 3D. By default it is switched off. The user can change the color of the outline in the color menu.
Transform options
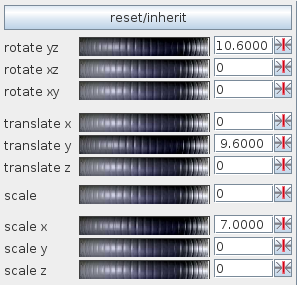
The user can carry out several object transformations:
- rotations: rotate yz, rotate xz, rotate xy
- translations: translate x, translate y, translate z
- scaling: scale, scale x, scale y, scale z
Transformation is executed by typing values into the text input fields on the right hand sides of the wheels or scrolling the wheel with the left mouse button. Right mouse button click on the wheel reduces sensitivity of the wheel, left mouse button click increases sensitivity.
Particular transformations can be reset using the small buttons on the right hand side next to the text fields.
Press the reset/inherit button to withdraw all transformations.