Module: City Plot
| input port | type | description | data acceptors |
|---|---|---|---|
| inField | VNRegularField | Regular Field 2D |
| output port | type | description | data schemas |
|---|---|---|---|
| outBox | VNRegularField | Regular Field 3D |
|
| outObj | VNGeometryObject | complete animated geometry |
Description
The city plot module creates a three-dimensional plot consisting of blocks where size and extents are based on the values of a scalar regular 2D field.
Input data
The input field is regular 2D with affine geometry.
Output data
The output is a geometry object.
Computation parameters
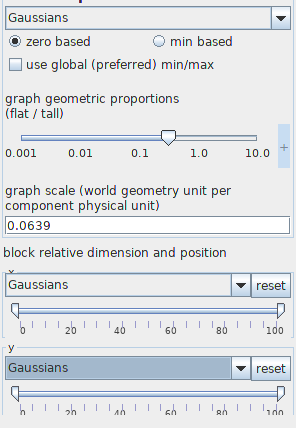
The graph component drop down list defines the component of the input field for which the city plot is created. By default the first component is used. All components are scalars, in case of vectors its value is used.
The user defines zero based or min based graphs. For zero based graphs blocks are drawn beginning from value zero. For min based graphs blocks are drawn beginning from the minimum value. By default the graph is zero based.
The option use global (preferred) min/max can be switched on if global minimum and maximum values should be used.
Both options graph geometric proportions and graph scale scale the height of the graph.
For the graph geometric proportions value 1 means that the height of the graph is near the size of the diameter of the field. The graph scale is the geometry unit per component physical unit. This means that when two graphs are connected to the same viewer 3D window, the right proportions of their height are preserved if the graph scale is of the same value.
The user defines the graph geometric proportions using either the slider or the text input fields for minimum, maximum and current value on the right hand side of the slider. The text input fields appear with mouse click at + on the right hand side of the slider, and disappear with mouse click at -.
The graph scale is defined by typing in a value to the text input field.
Width and depth of the blocks depend on the parameters in the block relative dimension and position menu.
The x and y drop down menus allow you to change block width (x) and depth (y) depending on the values of the chosen components. If a component is null, block width or depth is the same for all blocks. If the component is one of the field components, block width or depth are scaled depending on the values of the component.
The lower left corner position of the blocks in x and y direction, respectively, depend on the parameters which are chosen in the x and y double sliders.
Presentation parameters
Presentation tab contents are described in the common interfaces section unter the Presentation Panel entry.
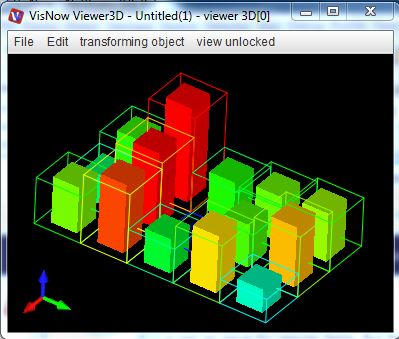
Example
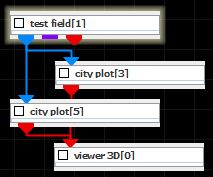
Choose a test field module from the test objects library, two city plot modules from 2D field mappers library and connect them. In the test field module choose 2D, Gaussians and Resolution 4.
In the both city plot module computation UI choose Gaussians graph component and the same appropriate graph scale and the option min based. In the presentation UI choose Gaussians as the color component. In one of the city plot modules choose in the Display tab of the Presentation menu all edges and switch off surfaces. In the other city plot leave the Display options unchanged, but define minimum and maximum of the block relative dimension and position sliders as 20 and 80, respectively.