Module: Graph 3D
Creates a graph of a scalar component of a 2D field
| input port | type | description | data acceptors |
|---|---|---|---|
| inField | VNField |
| output port | type | description | data schemas |
|---|---|---|---|
| outBox | VNRegularField | Regular Field 3D |
|
| regularGraphField | VNRegularField | ||
| irregularGraphField | VNIrregularField | ||
| outObj | VNGeometryObject | complete animated geometry |
Description
The graph 3D module creates a three-dimensional graph of a scalar regular 2D field. Color and height of the graph are determined independently by selectable input data components at that node.
Input data
The input field is regular 2D with affine geometry.
Output data
The output field is regular 2D with affine geometry. There is a geometry object of the field.
Computation parameters
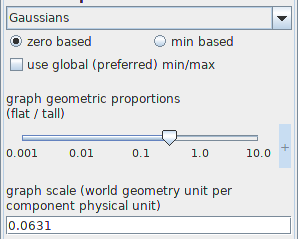
The graph component drop down list selects the component of the input field which will be presented in the graph. By default the first component is used.
The user defines zero based or min based graphs. For zero based graphs are drawn beginning from value zero. For min based graphs are drawn beginning from the minimum value. By default the graph is zero based.
The option use global (preferred) min/max can be switched on if global minimum and maximum values should be used.
Both options graph geometric proportions and graph scale scale the height of the graph.
For the graph geometric proportions value 1 means that the height of the graph is more or less the size of the diameter of the field. The graph scale is the geometry unit per component physical unit. This means that when two graphs are connected to the same viewer 3D window, the right proportions of their height are preserved if the graph scale is of the same value.
The user defines the graph geometric proportions using either the slider or the text input fields for minimum, maximum and current value on the right hand side of the slider. The text input fields appear with mouse click at + on the right hand side of the slider, and disappear with mouse click at -.
The graph scale is defined by typing in a value to the text input field.
Presentation parameters
Presentation tab contents are described in the common interfaces section unter the Presentation Panel entry.
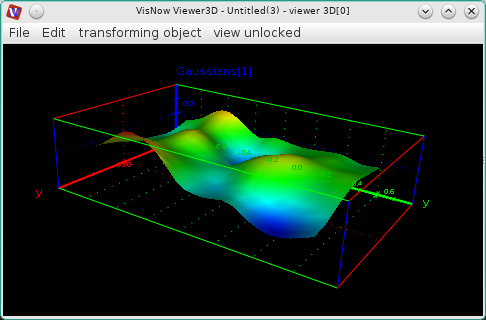
Example
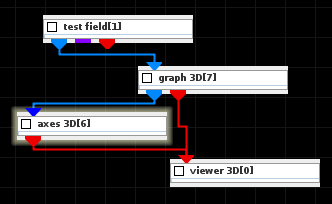
Choose the test field module from the test objects library, the graph 3D and axes 3D modules from the 2D field mappers library and connect them.
In the test field choose 2D and Gaussians. In the graph 3D module computation tab choose Gaussians graph component, an appropriate graph scale and switch the set axis to data range option on. In the presentation tab choose Gaussians as the color component. Choose an appropriate label size using the size slider in the axes 3D module UI.