Module: Isolines
Creates a series of isolines of a 2d field
| input port | type | description | data acceptors |
|---|---|---|---|
| inField | VNField | Regular Field 2D component of simple numeric type Regular Field 3D component of simple numeric type Irregular Field component of simple numeric type |
| output port | type | description | data schemas |
|---|---|---|---|
| outField | VNIrregularField | ||
| outObj | VNGeometryObject | complete animated geometry |
Description
The isolines module creates a series of contour lines of given constant values of 2D scalar data.
Input data
The input is a regular or irregular 2D field.
Output data
At output there is an irregular field of isolines and a geometric object of the field.
Computation parameters
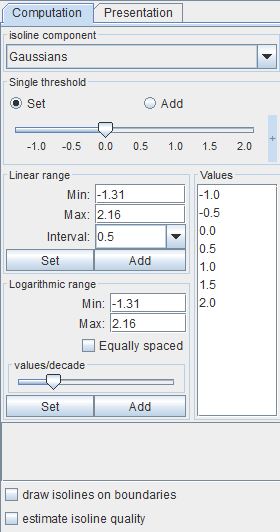
The isoline component drop down list defines the component for which isolines will be computed. For vector components its norm is used. By default the first component is chosen.
In the case of irregular data all input cell sets are listed below the isoline component drop down list. Choose appropriate cell sets from the list by ctrl/shift + left mouse click. Isolines are generated for chosen cell sets. If no cell set is chosen isolines are generated for all data.
The Single threshold slider defines a single isoline value. The user can change the value either using the slider or the text input fields for minimum, maximum and current values on the right hand side of the slider. The text input fields appear with mouse click at + and disappear with mouse click at -.
A radio button menu allows values to be set and added. If Set is switched on the slider determines a value for one isoline. If Add is switched on, every further slider value defines an additional isoline associated with the value. By default the set modus is switched on.
In the Linear range field the user can choose a set of evenly spaced isoline values between the Min and Max value and a user defined Interval. Press the Set button in order to generate a new set of values, press the Add button in order to add new values.
Similarly, for a Logarithmic range field the user chooses isoline values which are logarithmically spaced between Min and Max values.
The values/decade slider determines the number of isolines per decade. If the Equally spaced check box is switched on, isolines in each decade are equally spaced.
All values of generated isolines are listed in the Values text field. In order to remove values from the list select the values and choose Remove selected from a context menu which appears with right mouse click. The Remove all option removes all but one value from the list.
If the draw isolines on boundaries option is switched on isolines are drawn on the boundary of 3D objects. This option is active only in the case of 3D irregular fields.
If the estimate isoline quality check box is switched on, the module calculates a new variable relative_threshold_quality, an estimate for the quality of isolines. It can be used in the Presentation/Datamap menu and is included in the data output. By default, this option is switched off. It is available for regular fields.
Presentation parameters
Presentation tab contents are described in the common interfaces section unter the Presentation Panel entry.
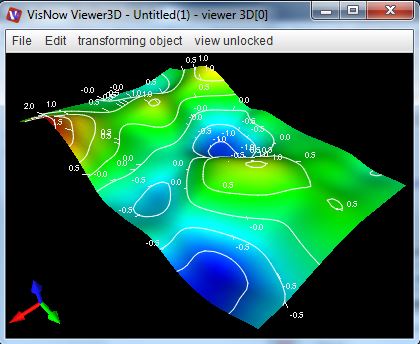
Example
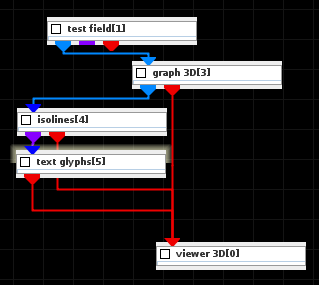
Choose the test field module from test objects library, graph 3D and isolines modules from 2D field mappers library and text glyphs from 3D field mappers library and connect the modules.
In the test field module choose 2D and Gaussians. In graph 3D module UI choose Gaussians as graph and color component, choose an appropriate graph scale. In the isolines module UI choose interval 0.5 and press set. In its GUI choose mapping component null and white color. In the text glyph module choose 2D texts and an appropriate font size. Choose background opacity \= 0.00.