Module: Planar Slice
Outputs a planar slice of a field as an irregular field and an interpolated regular field; optionally outputs a series of slices
| input port | type | description | data acceptors |
|---|---|---|---|
| inField | VNField | Regular Field 3D Irregular Field |
| output port | type | description | data schemas |
|---|---|---|---|
| currentOutField | VNIrregularField | ||
| accumulatedOutField | VNIrregularField | ||
| outObj | VNGeometryObject | Output of geometry object for 3D rendered volume |
Description
The planar slice module inserts a probe into a 3D regular or irregular field and extracts field values along a planar slice determined by successive probe positions. The module builds 2D fields at chosen probe positions and creates associated slice images.
Input data
The input field is 3D regular or irregular.
Output data
The first output port contains a 2D irregular field of node data of the current planar slice. The second output port contains an irregular field of node data of all selected planar slices. The third output port contains a geometry object.
Computation Parameters
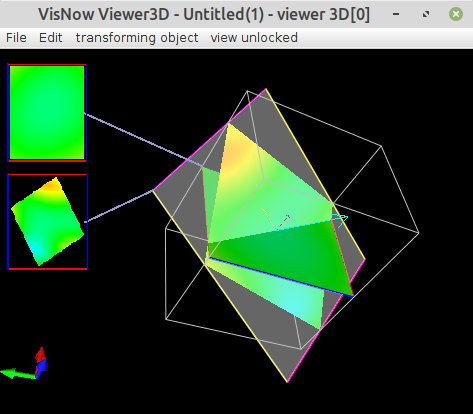
The probe is indicated by a plane segment together with a local orientation glyph. At the intersection of the probe with the geometric object and inside the user-defined box the plane segment is initially in grey color, later it may be colored by the mapping component.
The position of the probe can be chosen in a geometric modus or by index.
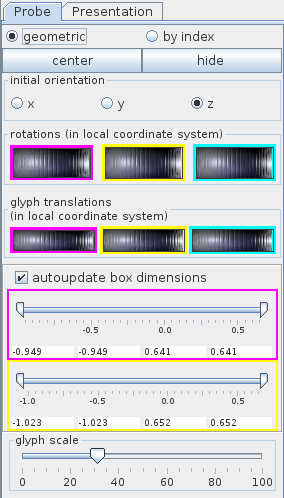
The geometric modus
The center button places the orientation glyph in the center of the plane segment.
The initial orientation radio button panel defines the direction x, y, or z which is orthogonal to the plane segment.
Rotate the probe around the local axes by scrolling the rotation wheels with the left mouse button. Right mouse button click on the wheel reduces sensitivity of the wheel, left mouse button click increases sensitivity. The color of the button frame correlates with the rotation axis.
With one of the three glyph translation wheels the user chooses the position of the probe and the annotation glyph by scrolling the wheel with the left mouse button. Right mouse button click on the wheel reduces sensitivity of the wheel, left mouse button click increases sensitivity. The color of the button frame correlates with the translation direction.
If autoupdate box dimensions is switched on the plane segment is automatically maximized and adapted to the 3D geometry after rotation/translation. If this option is switched off the area of the plane segment does not change. By default, this option is switched on.
The box geometric dimensions define a part of the plane segment of the probe. The intersection of this segment with the 3D geometry is colored in grey or by the mapping component. The user can change the extents of the plane segment using the double slider or the text input fields below the slider. If autoupdate box dimensions is switched on the plane segment is automatically maximized and adapted to the 3D geometry after rotation/translation. If this option is switched off the area of the plane segment does not change.
The glyph scale slider defines the size of the orientation glyph.
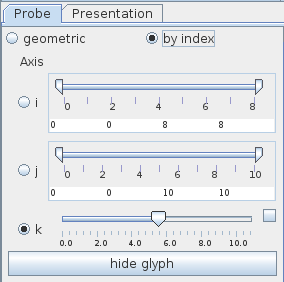
The by index modus
The Axis radio button panel defines the direction i, j, or k orthogonal to the plane segment. The slider value defines the plane and can be chosen using either the slider or the text input fields for minimum, maximum and current value on the right hand side of the slider. The text input fields appear if the option on the right hand side of the slider is switched on.
The remaining two double-sliders, which are not switched on, define the extents of the plane segment of the probe. The intersection of this segment with the 3D geometry is colored in grey or by the mapping component.
In both modes, the hide or hide glyph button hides the whole glyph after pressing the button. The glyph does not appear until the glyph position is changed.
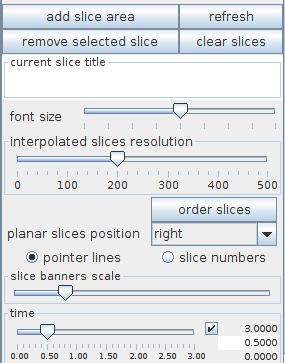
The remaining options are designed to create slice images of the plane segments in the user-defined positions.
Use the add slice area button in order to create a slice image of the intersection of the plane with the 3D geometry limited to the extents defined by the box geometric dimensions in geometric mode or the double sliders in by index mode.
In both cases slice images appear in a user-defined area in the 3D viewer. All images are connected with their position in the 3D geometry object by a line or are numbered such that the user can easily assign the images to their original position. The original position is indicated by a blue-red frame, which immediately allows the user to recognize the orientation of the slice image.
The remove selected slice button allows to remove the actually chosen slice image. The user can choose an image by clicking at the image in the viewer window. The connection line or the number of the image then turns into red color.
The clear slices button removes all slice images.
The refresh button refreshes all slices.
In both cases, removement includes removal of the image, the connection line to the 3D object, the numbering and the blue-red frame in the 3D geometry.
Each slice image can get a title by using the current slice title text input field. The user should choose the slice image by clicking on it.
The font size slider defines the font size of title and numbers of all images.
The interpolated slices resolution slider defines the image resolution of the slice images in the viewer window.
The order slices button allows you to reorder the slice images as best as possible.
The planar slice position popup menu defines the position of the slice images as right, left, bottom, top and at point. The first 4 possibilities relate to 4 directions in the viewer window. The option at point means that the image is situated near its original position in the 3D object.
The user can choose between the options pointer lines and slice numbers in a radio button menu. By default, the option pointer lines is switched on and means that all slice images are connected by a line to their original position in the 3D object. The actually chosen graph is indicated by a red line in opposition to white lines for all other graphs. If slice numbers is switched on the correspondence is indicated by numbers.
The slice banners scale slider scales the size of the slice images.
In case of time data the time slider allows to choose the appropriate time step of the data.
Options in the viewer window
Holding the mouse above a slice image there appears a table with values of all fields in this position.
Presentation parameters
Presentation tab contents are described in the common interfaces section unter the Presentation Panel entry.
Example
Choose the test field module from the test objects library and the planar slice module from 3D field mappers, choose 3D in the test field module UI and connect the modules.
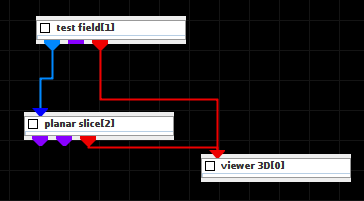
For appropriate glyph positions add slice areas.